How to browse multi-dimensional genomics data in Gitools?
Simple table:
Gitools accepts a matrix format (.tdm) that contains various values per cell - or in other words multi-value matrices. This is especially helpful for browsing genomic data as nowadays study data is being released with expression, mutation, CNA and more data for each patient.
Files/Data needed
For whatever data you want to browse, you need to prepare a Multi-value data matrix (TDM). For genomics data it may look like this:
| column | row | expression | CNA | mutation |
|---|---|---|---|---|
| patient_01 | gene_A | 8.5 | 0 | 0 |
| patient_01 | gene_B | 2.3 | -2 | 0 |
| patient_02 | gene_A | 6 | 0 | 1 |
| patient_02 | gene_B | 5 | 0 | 0 |
| patient_03 | gene_A | 12.1 | 2 | 0 |
| patient_03 | gene_B | 4.9 | 0 | 1 |
This is an example with three columns and two rows. Each cell has three data values. Download this example matrix: files/multivalue-matrix-example.tdm.
Browse in Gitools
Select the option File -> Open -> Heatmap
In the dialog that pops up select as file Filter (the lowest box) one of the following two options:
- Multivalue data matrix (tdm, tdm.gz)
- Multivalue data matrix (*.*)
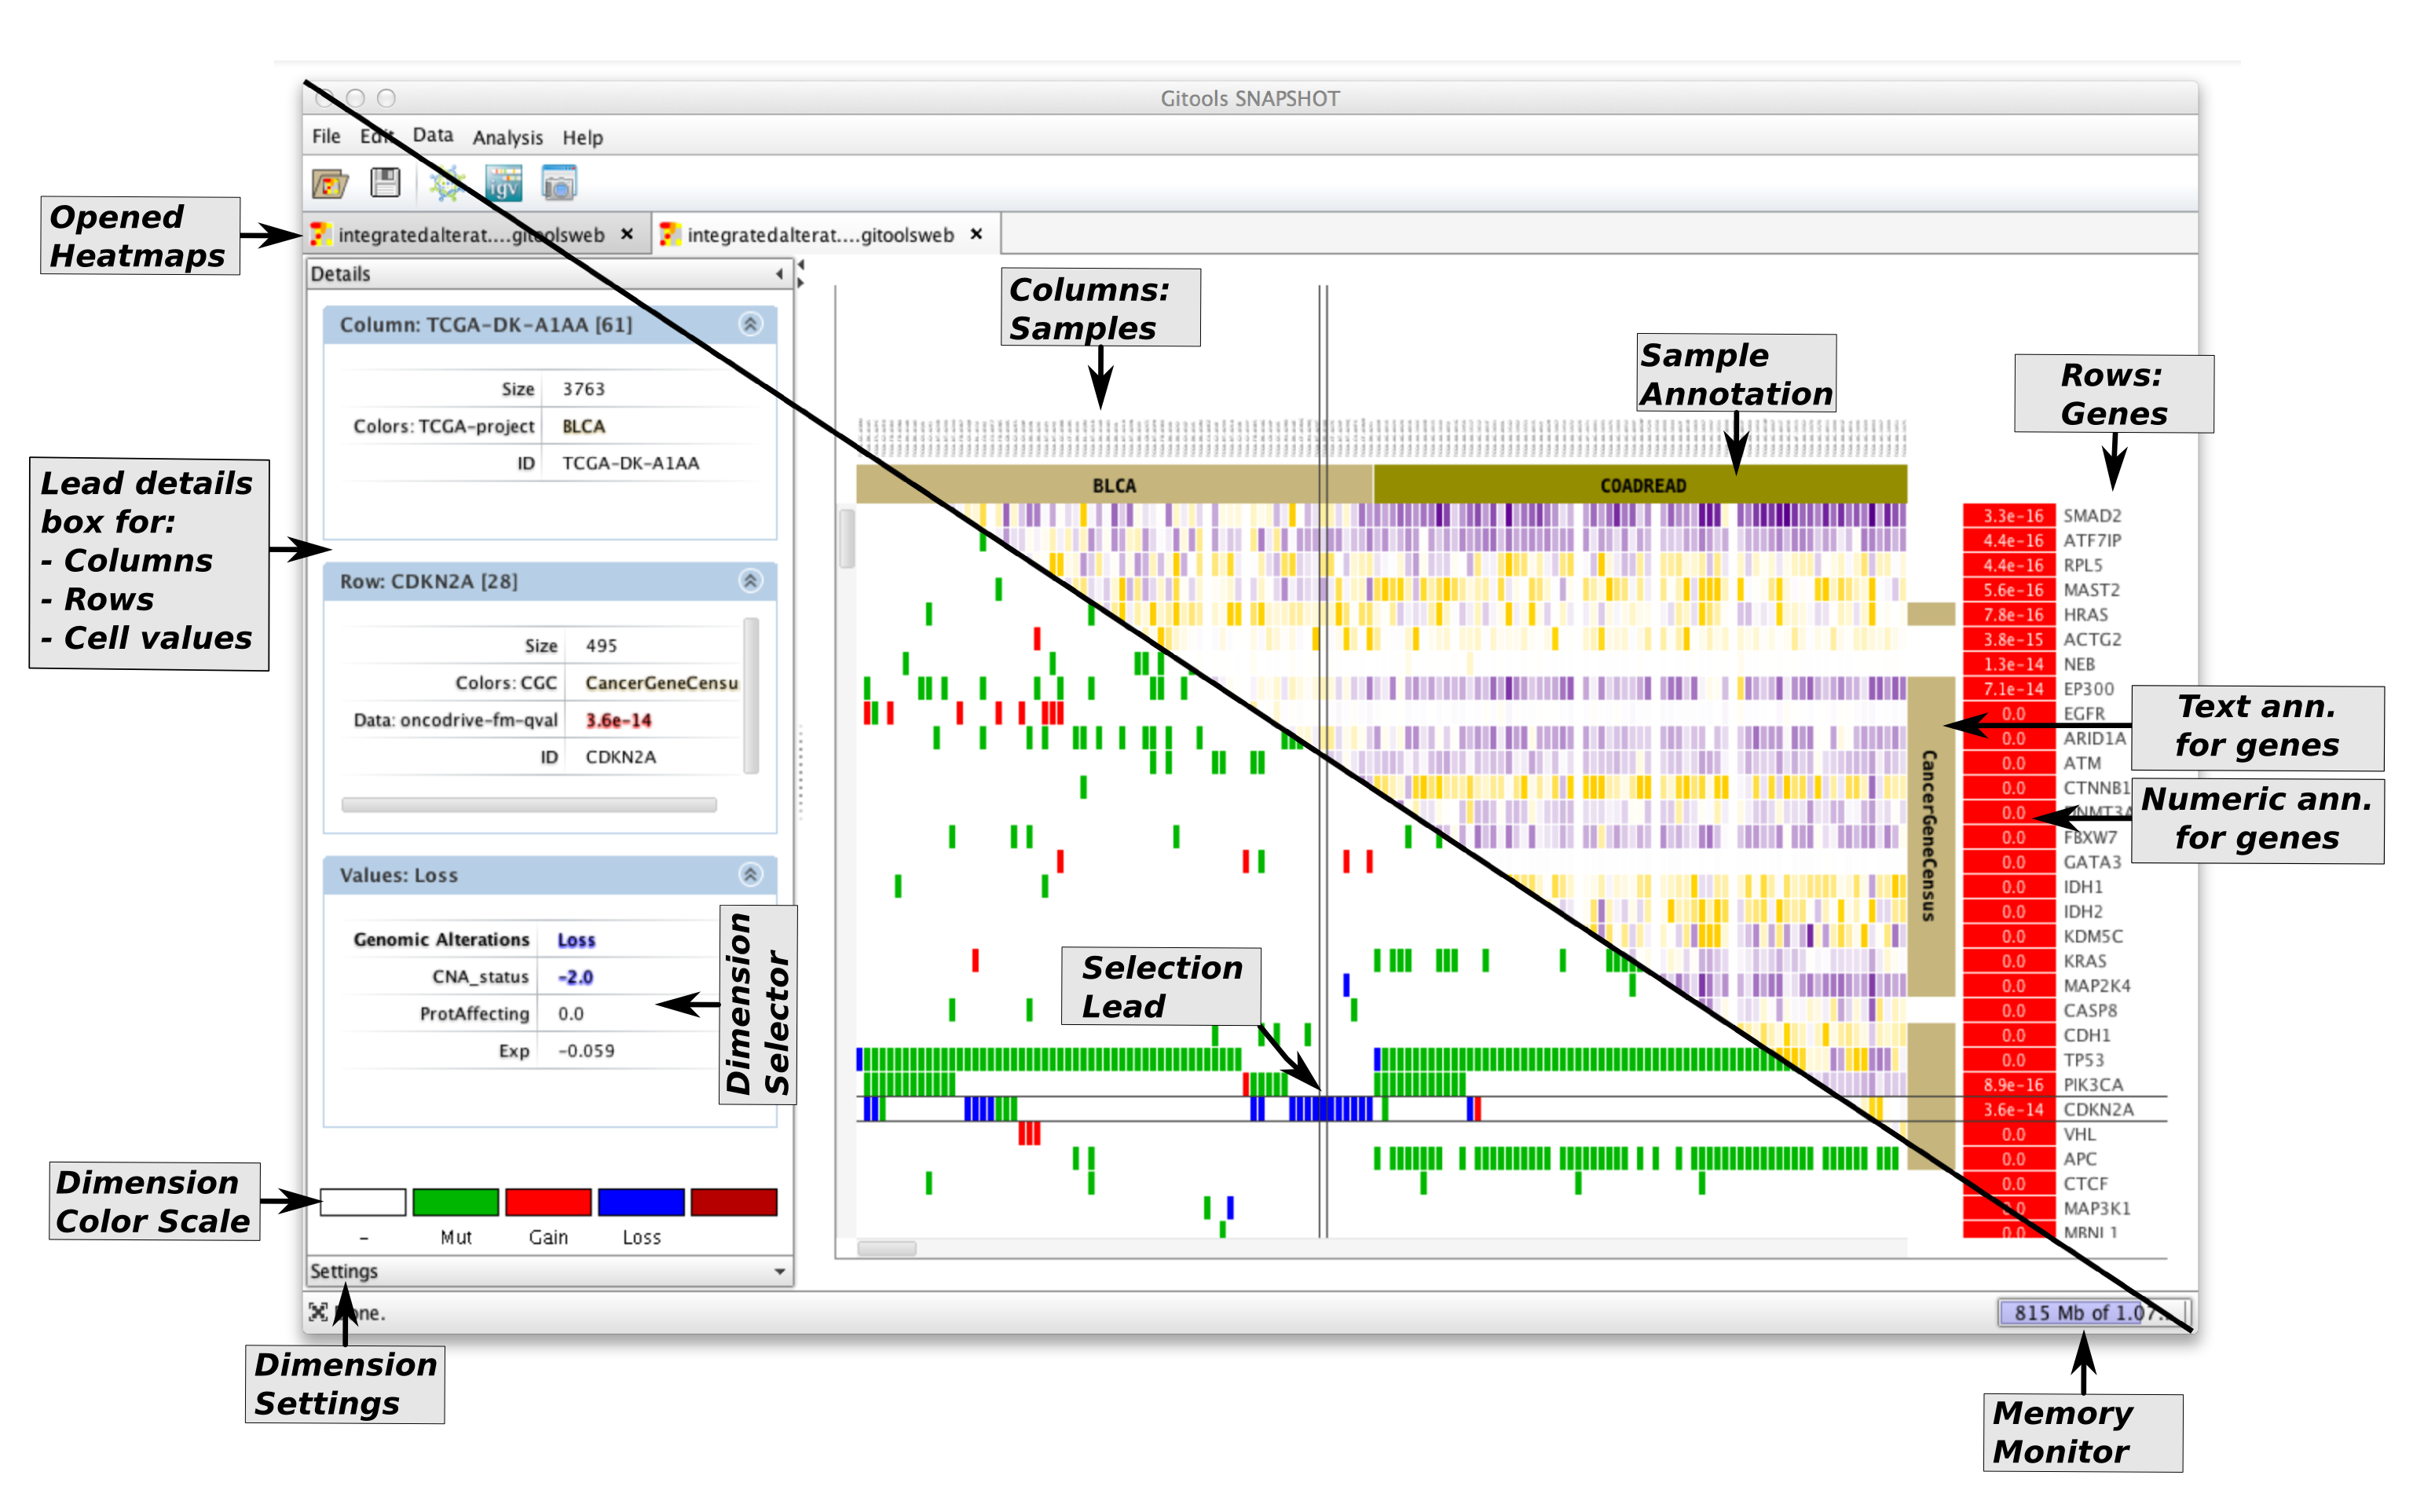
Once the heatmap is opened in Gitools, go click on the dimension of data you want to see in the details dialog to the left (see Dimension selector in the screenshot to the right)